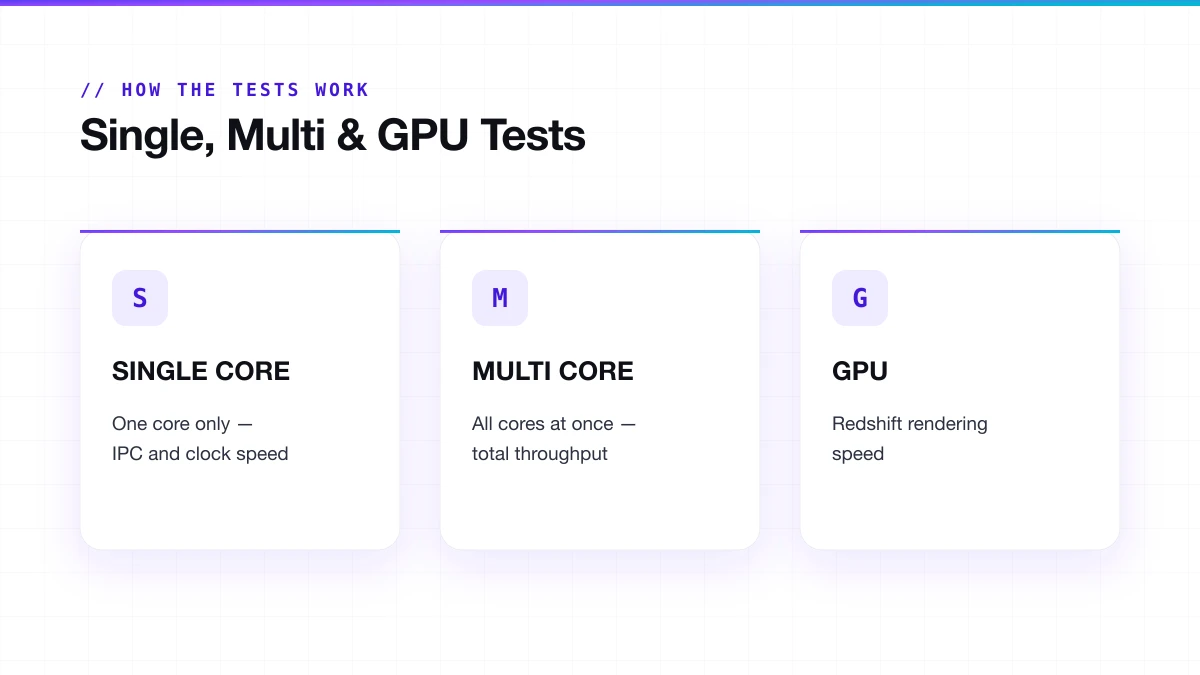
CinebenchBenchmark Guide
Benchmark Ready · v2026.1

Cinebench 2026: Free Download, Scores & the Complete Benchmark Guide

Cinebench gives you a reliable number to work with. It is free, cross-platform, and built on the same Cinema 4D engine that professional 3D artists use every day. Single-core, multi-core, and GPU scores in one tool.

Free · No account · Windows · macOS · ARM

Cinebench 2026v26.1
SINGLE CORE0pts
MULTI CORE0pts
GPU0pts
MP RATIO 1.34

rendering scene · complete

// OVERVIEW

What Is Cinebench?

Cinebench is a free software for testing the performance of CPUs and GPUs. Developed by Maxon, it has served as a gold-standard test for the hardware industry for more than two decades.

It renders a full 3D model using the same engine that professional designers use in their day-to-day workflow, so the results reflect the true performance of the hardware rather than just a synthetic workload.

Cinebench results screen showing single-core, multi-core, and GPU scores
Cinebench 2026 results: single-core, multi-core and GPU scores
FREE
Available free of charge, without registration or subscription.
CROSS-PLATFORM
Works on Windows (x86-64 and ARM64) and macOS (Apple Silicon included).
TRUSTED
Used by hardware reviewers, PC enthusiasts, IT professionals, and overclockers.
COMPARABLE
Scores are cross-platform, so you can compare a Mac against a Windows PC fairly.
// REQUIREMENTS

Cinebench 2026 System Requirements

Cinebench 2026 is more demanding than previous versions, not just on your CPU during the test, but on your hardware as a baseline.

RequirementWindowsmacOS
OSWindows 10 or 11 (64-bit or ARM64)macOS 12 or later
RAM8 GB minimum / 16 GB recommended16 GB recommended
GPU VRAM (for GPU test)8 GB dedicated VRAM16 GB unified memory
GPU compatibilityNVIDIA Blackwell, Ada; AMD RDNA 4Apple M4, M5
CPU architecturex86-64, ARM64x86-64, Apple Silicon

You can run the CPU tests without meeting the GPU requirements. The GPU test simply will not run if your card does not meet the VRAM threshold. That is not a failure, it just means the test does not apply to your hardware.

// GET CINEBENCH

How to Download Cinebench

Cinebench is free. No account, subscription, or payment is required to download it.

Which version to download

You NeedDownload This
Benchmarking current hardware in 2026Cinebench 2026
Comparing against older CPU databasesCinebench R23
Testing a GPU released before 2024Cinebench 2024
Historical comparison onlyR20 or R15

How to Download

01
Scroll to the download button on this page
02
Select the version you need from the options listed
03
Choose your operating system: Windows, macOS, or ARM
04
Click the download button and save the installer to your system
05
Verify the checksum before running; Maxon publishes these officially and it confirms your file is clean

If you are benchmarking new hardware in 2026, Cinebench 2026 is the right choice. If you need to compare against an existing score database from older reviews, download R23 alongside it.

// FIRST RUN

How to Run Cinebench 2026 the First Time

Preparing your system

  • Update your OS, BIOS, and GPU drivers to the latest available versions
  • Restart your PC fresh; do not benchmark a system that has been running for hours
  • Plug your laptop in, never benchmark on battery power
  • Set your Windows power plan to High Performance or Balanced
  • Disable any overclocks temporarily if you want a clean stock baseline
  • Let the system sit idle for 5 minutes after boot before you start

Closing background applications

  • Close browsers, Discord, Spotify, and any streaming or communication apps
  • Pause cloud sync tools like OneDrive, Dropbox, or Google Drive
  • Disable antivirus real-time scanning temporarily if possible
  • Open Task Manager and kill anything using more than 1 to 2% CPU at idle
  • Disconnect from the internet if you want to eliminate background update checks entirely

Selecting your test

Single Core

one core, measures IPC and clock speed

Multi Core

all cores at once, measures total rendering throughput

SMT

new in 2026, measures threading efficiency and produces your MP ratio

GPU

measures Redshift rendering performance on your graphics card

Run them in order for a complete picture. Single core first, then multi core, then SMT, and then GPU.

Running the benchmark

01
Click Start on your chosen test
02
Do not touch the system while it runs
03
Do not open apps, move windows, or plug in USB devices mid-test
04
Let it finish completely. Cinebench 2026 enforces a minimum runtime by default
05
Wait for the score to appear on screen before doing anything else

Reading your results

  • Score is your result as a number, higher means faster
  • MP Ratio appears after the SMT test, shows threading efficiency
  • The result screen includes a basic comparison against other hardware in Maxon's database

Write down your score alongside your system config: CPU model, cooler, RAM speed, and BIOS version. A score without that context is hard to compare or troubleshoot later.

Run it twice

  • The first run is often slightly lower because the CPU is still warming up
  • The second run gives you the stable, representative number
  • If the second run drops more than 10% below the first, you have a thermal issue worth investigating

Advanced Benchmark Mode

Advanced
  • Runs multiple consecutive loops instead of one
  • Reveals whether your CPU holds performance under sustained load or drops off
  • Essential for laptops, small form factor builds, and any system where throttling is suspected
  • Run 3 to 5 loops and compare the first score against the last
  • A drop over 20% across loops means your cooling cannot keep up

Tips for consistent scores

  • Run the benchmark twice; at a minimum, the first run is always the warm-up
  • Match the ambient room temperature across test sessions if you are comparing over time
  • Write down your driver version, RAM speed, and BIOS version alongside every score
  • If scores feel unexpectedly low, temporarily disable XMP or EXPO in BIOS to isolate whether memory is causing instability
// INTERPRETATION

How to Read Your Cinebench Scores

A number means nothing without context. Here is what each score actually tells you.

Single-Core Score

  • High single-core = faster at gaming, app launches, anything that runs on one thread
  • Scores vary by CPU generation and architecture, not just clock speed
  • A 2026 Ryzen chip will outperform a 2020 chip at the same GHz because of IPC improvements
  • Compare the same-version single-core scores only. R23 and 2026 single-core numbers are not comparable

Multi-Core Score

  • Reflects total rendering throughput across all cores and threads
  • The number that content creators and 3D artists care most about
  • Watch for drops between runs. A drop of 20% or more means thermal throttling
  • High-core-count CPUs win here; gaming CPUs with 8 cores lose to workstation chips with 24

SMT / MP Ratio

  • The MP Ratio is the multi-core score divided by the single-core score. In Cinebench 2026, it also reflects SMT efficiency specifically.
  • A ratio of 1.3 means your CPU gains roughly 30% extra performance from running two threads per core.
  • A ratio close to 1.0 means SMT is adding almost nothing.

GPU Score

  • Measures Redshift GPU rendering speed
  • Useful for Cinema 4D users and GPU rendering workflows
  • Not a gaming benchmark, frame rates in games are tested differently
  • Higher GPU score = faster Redshift renders in actual production work
// UNDER THE HOOD

How Cinebench Benchmarks Work

Cinebench renders a fixed, complex 3D scene and measures how fast your hardware completes it. The faster the render, the higher the score. Every version uses the same approach, but scene complexity, engine version, and scoring scale differ between releases.

Single-Core Test

This test uses one CPU core to render the scene. It runs one thread at a time, no multitasking.

  • Measures clock speed and IPC (instructions per clock)
  • Tells you how fast your CPU handles tasks that cannot be parallelised
  • Relevant to gaming, app launch speed, and everyday responsiveness
  • Score scales with architecture quality, not just GHz

A CPU with a high clock speed but weak architecture can score lower than a slower chip from a newer generation. That is what IPC means in practice.

Multi-Core Test

This test uses every available core and thread at the same time.

  • Measures total rendering throughput
  • Shows how well your CPU handles heavy parallel workloads
  • Heavily affected by cooling and power limits
  • Where high core count CPUs shine

If your multi-core score drops between runs while the single-core score stays stable, your cooling system is the problem, not the CPU.

SMT Core Test (New in Cinebench 2026)

New in 2026

SMT stands for Simultaneous Multithreading. Intel calls it Hyper-Threading. It allows one physical core to handle two threads at the same time. Previous Cinebench versions never directly measured SMT benefit. They just used it silently in the multi-core test.

Cinebench 2026 isolates this. It runs a single physical core twice: once with SMT enabled, once without. The difference gives you the MP Ratio.

  • AMD Ryzen CPUs show roughly a 31% performance gain with SMT enabled on this scene
  • Intel's SMT implementation performs differently, and you can now see exactly how
  • Useful for evaluating CPUs with asymmetric core designs (efficiency cores vs. performance cores)
  • Helps diagnose whether SMT is enabled in your BIOS or is being blocked by power limits

GPU Test (Redshift)

Introduced in Cinebench 2024 and updated in Cinebench 2026. This test uses Redshift, a GPU-accelerated renderer, to measure graphics card rendering performance.

  • Requires 8 GB VRAM minimum on Windows
  • Requires 16 GB unified memory on Apple Silicon
  • Cinebench 2026 adds support for NVIDIA Blackwell (RTX 5000 series), AMD Radeon 9000 series, and Apple M4 and M5
  • Score reflects how fast your GPU renders the Redshift scene, not how fast it plays games
Comparison of Cinebench single-core, multi-core, and GPU benchmark tests
The three core Cinebench tests: single-core, multi-core and GPU
// SIGNATURE METRIC

What Is the MP Ratio in Cinebench?

Formula
MP Ratio=Multi-Core ScoreSingle-Core Score

In Cinebench 2026 this ratio has new meaning because the SMT test runs in isolation, so you see exactly how much SMT contributes on this specific workload.

MP RatioWhat It Suggests
Below 1.2SMT is contributing very little, or may be disabled
1.2 to 1.35Normal SMT gain for most Intel chips
1.35 to 1.5Strong SMT benefit, typical on AMD Zen 4 and Zen 5
Above 1.5Excellent SMT efficiency, usually high-core-count workstation CPUs

A lower-than-expected MP ratio often means the cooler is throttling the CPU during the sustained multi-core run, even if single-core looks fine.

// RELEASE

What's New in Cinebench 2026

Cinebench 2026 was released on December 29, 2025. It is not a minor update. The scoring baseline reset completely.

  • Built on the latest Redshift rendering engine; same code running inside Cinema 4D 2026

  • Compiled with Clang V19 compiler, which is more accurate and faster at translating workloads to modern hardware

  • A multi-threaded workload is 6x harder than Cinebench R23

  • The SMT core test is now on the main screen. It was hidden in Advanced Mode before

  • The single-core test is also accessible from the main screen without switching to Advanced Mode

  • GPU support now includes NVIDIA Blackwell (RTX 5000 series), AMD Radeon 9000 series, and Apple M4 and M5

  • Minimum runtime is enforced by default, which prevents burst-speed scores that do not reflect sustained performance

  • Scores cannot be compared to any prior version

Your R23 database, your 2024 scores, and your R20 results: none of them cross over to 2026. You start fresh.

Cinebench 2026 versus 2024 engine and feature comparison
Cinebench 2026 vs 2024: engine, tests, GPU support and workload
// REFERENCE RANGES

Cinebench 2026 Scores

These are reference ranges. Your actual score depends on cooling quality, RAM speed, BIOS power settings, and ambient temperature. Two systems with the same CPU can legitimately differ by 10 to 15 per cent.

Multi-Core Scores (Cinebench 2026)

CPU TierExample CPUsMulti-Core RangeSingle-Core Range
BudgetRyzen 5 7600, Core i5-144002,000 to 3,500100 to 130
Mid-RangeRyzen 7 9700X, Core i7-14700K4,000 to 6,500130 to 160
High-EndRyzen 9 9950X, Core i9-14900K7,000 to 10,000+160 to 195
WorkstationThreadripper 7970X15,000+170 to 185
Cinebench multi-core score ranges by CPU tier (budget to workstation)
Multi-core score ranges by CPU tier: budget to workstation
Budget2,000–3,500 pts

Ryzen 5 7600, Core i5-14400

Mid-Range4,000–6,500 pts

Ryzen 7 9700X, Core i7-14700K

High-End7,000–10,000+ pts

Ryzen 9 9950X, Core i9-14900K

Workstation15,000+ pts

Threadripper 7970X

The workstation single-core score is actually lower than many high-end desktop chips. That is because workstation chips trade per-core speed for more cores. Multi-threaded workloads are where they dominate.

Important Points

  • Scores at the top of a range usually require high-end cooling, fast DDR5, and XMP enabled
  • Scores at the bottom of a range often reflect laptops, power-limited systems, or poor thermal conditions
  • Apple Silicon scores a bit differently. M4 and M5 are competitive with high-end desktop chips in single-core, but the scoring context differs because they use unified memory, not discrete VRAM
  • Overclocked systems can push past the high-end range, but those results are not representative of stock performance and should be labelled as such

GPU score reference for Cinebench 2026

GPU TierExample GPUsGPU Score Range
EntryRTX 4060, RX 76005,000 to 9,000
Mid-RangeRTX 4070, RX 7800 XT10,000 to 18,000
High-EndRTX 4090, RX 7900 XTX22,000 to 40,000
Latest GenRTX 5090, RX 9070 XT40,000 to 110,000+

GPU scores in Cinebench 2026 are on a much wider scale than CPU scores because the rendering engine can leverage the much higher parallelism of modern GPUs. A 5070 Ti should score around 110,000 points under ideal conditions, according to early community testing.

// SUSTAINED LOAD

Cinebench as a Stress Test

Cinebench is not a dedicated stress test, but it gets used as one constantly. It is a render benchmark, not a torture test. The difference matters. Prime95 and similar tools push your CPU harder, for longer, with more heat. Cinebench's default minimum runtime is shorter and focused on render accuracy, not maximum load. Which means running Cinebench 2026 in Advanced Mode for 3 to 5 consecutive loops does generate enough sustained load to reveal real problems.

What it exposes
It exposes thermal throttling
What it exposes
It shows whether your CPU holds boost clocks under extended load or drops back
What it exposes
It tells you if your cooler is keeping up or failing
What it exposes
It tests power delivery stability in a way that single runs cannot
What it exposes
It is also a useful check after any hardware change: new cooler, repasted CPU, new case, because you get a consistent, repeatable result you can compare

How to loop Cinebench for stress testing

01
Open Cinebench 2026 and switch to Advanced Benchmark Mode
02
Set the run count to 5 or more
03
Open a temperature monitoring tool alongside it
04
Let all runs complete without touching anything
05
Compare the multi-core score from run 1 against run 3 and run 5
06
Note the highest temperature reached during the test

The goal is not a single high score. The goal is consistency. A CPU that scores 8,500 on every run is more useful for heavy workloads than one that hits 10,200 on the first run and 7,100 by the fifth.

// DIAGNOSTICS

What Score Drops Mean

Drop Between RunsLikely Cause
Under 10%Normal warm-up behaviour, no concern
10 to 20%Mild thermal pressure, the cooler is working hard
20 to 30%Thermal throttling is active, check temperatures
Over 30%Serious cooling problem or power limit issue
// VERSIONS

Cinebench Version Comparison

Every version tests different things with different scenes and scoring scales. None is compatible with the others.

VersionReleasedEngineCPU TestsGPU TestScore Comparable To
R152013Cinema 4D (older)Single, MultiNoR15 only
R202018Cinema 4D (updated)Single, MultiNoR20 only
R232021Cinema 4DSingle, MultiNoR23 only
2024Late 2023RedshiftSingle, MultiYes2024 only
2026Dec 2025Redshift (latest)Single, Multi, SMTYes2026 only

R15 and R20 can still be found in old hardware reviews. If you are evaluating an old CPU introduced before 2021, there is something for comparison. It gives no information on how that CPU performs compared to newer hardware in Cinebench 2026.

R23 is still the version with the biggest existing database of results. In case of a CPU tested in either 2022 or 2023, it remains the best point of reference for comparing performance with other CPUs. Do not mix up R23 with 2026 scores.

// VARIANCE

Why Scores Vary Between Similar Systems

Two people with the same CPU post different scores, and one of them thinks something is wrong. But usually nothing is wrong. Here is why scores vary legitimately:

Ambient temperature

A room at 20°C versus 28°C makes a measurable difference in cooling headroom and, therefore, sustained clock speeds

Cooler quality and mounting

A poorly mounted 360mm AIO performs worse than a well-mounted 240mm one

Thermal paste age and application

Old or unevenly applied paste throttles performance before temperatures even look alarming in monitoring software

RAM speed and timings

On AMD Ryzen, Infinity Fabric speed ties directly to memory frequency. Slower RAM equals lower scores, even with identical CPU settings

BIOS power limits

Many laptop vendors and some desktop board manufacturers ship conservative power limits. The CPU physically cannot use its full boost

Driver versions

Especially relevant for GPU scores, but CPU microcode updates also shift results

XMP or EXPO status

A CPU running at the wrong memory speed shows a noticeably lower multi-core score

Background processes

A single background process writing to disk during the run is enough to shift the score by a few percent

Windows power plan

Running on Balanced or Power Saver instead of High Performance caps boost behaviour and visibly reduces scores

Motherboard tier

Budget B-series boards frequently ship with power limits below the CPU's rated TDP. The chip runs fine, but cannot boost as aggressively

// COMPARISON

Cinebench vs Other Benchmarks

Cinebench is excellent at one thing: measuring rendering performance. It is not a system-wide benchmark. It does not test memory bandwidth, storage speed, or gaming performance. Use it alongside other tools, not instead of them.

BenchmarkMeasuresBest For
Cinebench 2026CPU render, GPU Redshift, SMT efficiency3D professionals, hardware buyers, overclockers
Geekbench 6CPU integer, floating point, machine learningGeneral cross-device comparison, including mobile
Blender BenchmarkGPU and CPU renderingContent creators using GPU-accelerated workflows
PassMarkCPU, RAM, disk, and GPU combinedFull system overview and purchase decisions
3DMarkGaming GPU performanceGamers testing rasterisation and ray tracing for games
Prime95CPU stability under maximum loadOverclockers validating stability, not performance

The key thing to understand is that these benchmarks are not competing. They measure different things. A CPU that wins in Cinebench might not top a gaming benchmark because games and renders stress hardware in completely different ways.

// DECISION GUIDE

Which Version Should You Run?

If you are not sure which Cinebench to download, here is the short version:

2026

Benchmarking hardware in 2026

Run Cinebench 2026. It is the current standard and the only one that tests SMT directly.

R23

Comparing to an older CPU database

Run Cinebench R23 alongside 2026. Never mix the scores.

2026

GPU benchmarking

Cinebench 2026 if your GPU supports it (RTX 40/50 series, Radeon 7000/9000, Apple M4/M5).

2026

Laptop testing

Cinebench 2026 Advanced Mode. Pay attention to score consistency across multiple runs, not just the peak.

2026

Stress testing

Cinebench 2026 Advanced Mode, 3 to 5 loops, with a temperature monitor open alongside it.

R23R20R15

Historical research on older CPUs

R23 for 2021 to 2024, R20 for 2018 to 2021, R15 for older than that.

// TROUBLESHOOTING

Common Problems and Their Solutions

The score is much lower than expected

  • Check that XMP or EXPO is enabled in BIOS; running at JEDEC speeds significantly lowers scores on AMD
  • Confirm your power plan is set to High Performance or Balanced, not Power Saver
  • Check background processes: antivirus scans, cloud sync, and update checks all affect results
  • Run the benchmark twice and compare. The first run is often lower

Score drops significantly between runs

  • This is thermal throttling. Your CPU is hitting its temperature limit under sustained load
  • Check cooler mounting pressure and reapply thermal paste if the system is more than two years old
  • Verify your case has adequate airflow. A sealed case with no exhaust fans is a problem
  • Check BIOS power limits, especially on B-series motherboards that may cap the CPU below its rated TDP

GPU test fails to run

  • Confirm your GPU has at least 8 GB VRAM (Windows) or 16 GB unified memory (Apple Silicon)
  • Update GPU drivers to the latest version before running the test
  • Check that your GPU is supported in Cinebench 2026. Older cards from before 2020 may not be

Scores vary wildly between identical-looking systems

  • Check the ambient temperature difference
  • Compare BIOS versions; manufacturers frequently change power limits between firmware versions
  • Check memory speed in CPU-Z or similar, DDR4 vs DDR5, and whether it is running at the advertised speed
  • Verify both systems are running the same version of Cinebench with identical test settings
// FAQ

Frequently Asked Questions

Can I compare Cinebench 2026 scores with R23?

No. If you mix them in a comparison, the numbers are meaningless. Always run the same version across every system you are comparing.

Is Cinebench free?

Yes. Always has been, for every version from R15 to 2026. You download it at no cost, no registration, no time limit. There is no Pro version.

What is the MP ratio in Cinebench?

In Cinebench 2026, it also directly reflects your CPU's SMT efficiency; how much performance you gain by running two threads per core versus one. A ratio of 1.3 means SMT adds about 30% on this workload.

What are good Cinebench 2026 scores?

It depends on your CPU tier. Budget chips score 2,000 to 3,500 multi-core. Mid-range lands between 4,000 and 6,500. High-end chips like the Ryzen 9 9950X push past 10,000.

Why did my score drop between runs?

Thermal throttling. Your CPU hit its temperature ceiling during the sustained multi-core load and had to reduce clock speed to stay within limits. A drop of over 25% means your cooling solution needs attention.

Does Cinebench run on macOS?

Yes. Cinebench 2026 runs natively on macOS, including Apple Silicon chips. M4 and M5 are officially supported. M1, M2, and M3 also work, but check the current compatibility list for full details.

Can I run Cinebench on Linux?

There is no native Linux version of Cinebench. Some users run it through Wine or Proton compatibility layers, but the results are unreliable for comparison purposes.

What changed between Cinebench 2024 and 2026?

The multi-threaded workload is 6x heavier. The SMT core test is completely new. GPU support expanded to NVIDIA Blackwell and AMD RDNA 4.

// FINAL WORD

Run Cinebench 2026. Note Your MP Ratio.

Cinebench 2026 reset the baseline. The new SMT test is the most meaningful addition in years. For the first time, you can see exactly what Hyper-Threading or SMT contributes to your CPU's rendering performance.

Run Cinebench 2026. Note your MP ratio. Run it in Advanced Mode if you want to know what your cooler is actually capable of. And stop comparing R23 numbers to 2026 numbers. They are different benchmarks wearing the same name.