Cinebench 2026 Scores: Full CPU & GPU Database
Cinebench 2026 CPU and GPU scores, score ranges by tier, and what a good score looks like, plus R23 reference data and how the scale changed.
Cinebench 2026 is the newest version of the Maxon CPU/GPU benchmark, running off the Redshift render engine found in Cinema 4D 2026. Scores from prior versions cannot be compared to 2026 results, which use an entirely different scale.
Launched at the end of December 2025, it was an upgrade to Cinebench 2024 that included a much higher workload, introduced a new SMT core test, and offered improvements to GPU testing for NVIDIA's Blackwell chips and AMD's RDNA 4 GPUs. This guide explains what scores mean, what the best CPUs and GPUs score, what constitutes a good score in 2026, and how you can optimize your benchmarking. For setup and download, start with our complete Cinebench guide.
What Is Cinebench 2026?
Cinebench is a freeware benchmark developed by Maxon which makes use of the Redshift engine in Cinema 4D 2026 for testing the capabilities of the CPU and GPU. In contrast to other benchmarks where one performs calculations, Cinebench creates a 3D picture. As a result, what you get is a realistic estimation of your computer's ability to perform renderings. The program works under Windows x86-64, Windows ARM64, and macOS.
There are three test modes:
- Multi-Core: all cores under sustained load.
- Single-Thread: one thread, no SMT.
- Single-Core with SMT: one core, both threads active (new in 2026).
Top Cinebench 2026 Multi-Core Scores (Desktop CPUs)
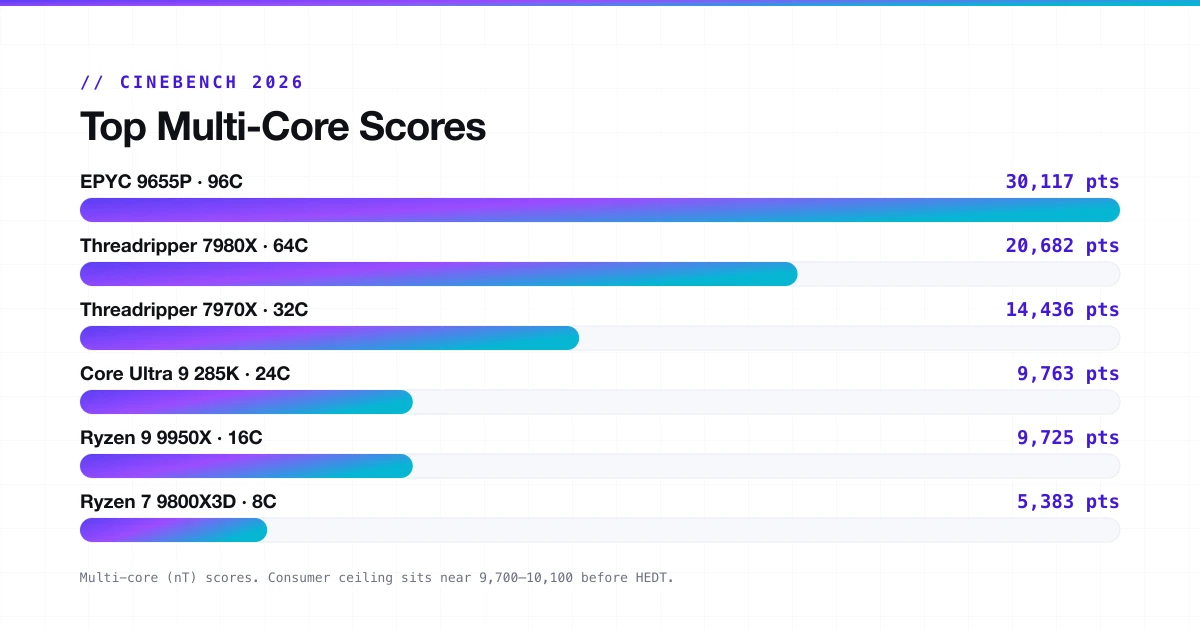
The top of the chart is dominated by workstation and server chips. The EPYC 9655P leads at 30,117 points because it has 96 cores and 192 threads. That is not a consumer chip.
| CPU | Cores / Threads | CB 2026 nT |
|---|---|---|
| AMD EPYC 9655P | 96C / 192T | 30,117 pts |
| Ryzen Threadripper PRO 7995WX | 96C / 192T | 30,020 pts |
| Ryzen Threadripper 7980X | 64C / 128T | 20,682 pts |
| Ryzen Threadripper 7970X | 32C / 64T | 14,436 pts |
| Intel Core Ultra 9 285K | 24C / 24T | 9,763 pts |
| Intel Core i9-14900K / KF | 24C / 32T | 9,758 pts |
| AMD Ryzen 9 9950X | 16C / 32T | 9,725 pts |
| AMD Ryzen 9 9950X3D | 16C / 32T | 9,725 pts |
| AMD Ryzen 7 9800X3D | 8C / 16T | 5,383 pts |
| AMD Ryzen 7 7800X3D | 8C / 16T | 4,386 pts |
For most people building or buying a PC in 2026, the 9950X and Core Ultra 9 285K are the practical ceiling before you enter HEDT territory.
Top Cinebench 2026 Single-Core Scores
Single-core scores tell a different perspective. Core count stops mattering here. What counts is clock speed, IPC, and how well a chip handles sustained boost.
| CPU | CB 2026 SC (SMT) | CB 2026 ST |
|---|---|---|
| AMD Ryzen 7 9850X3D | ~780 pts | ~600 pts |
| AMD Ryzen 9 9950X3D | ~768 pts | ~590 pts |
| Apple M5 (10-CPU) | ~737 pts | ~700 pts |
| AMD Ryzen 9 9955HX | ~700 pts | ~540 pts |
| Intel Core Ultra 9 285K | ~610 pts | ~578 pts |
| AMD Ryzen 9 9950X / 9700X | ~600 pts | ~525 pts |
| AMD Ryzen 7 9800X3D | ~545 pts | ~430 pts |
The SC (Single-Core with SMT) column is new in 2026. On Zen 5 CPUs, running SMT on a single core adds roughly 35% to the result compared to pure single-thread. That gap narrows on Intel's hybrid architecture because E-cores do not support SMT the same way. To understand this number, read our MP Ratio guide.
Ryzen 7 9800X3D Cinebench Score
The 9800X3D is the most popular gaming CPU going into mid-2026. It also generates the most benchmark confusion. Here is what is actually happening.
Multi-Core
5,383 pts
Single-Core (SMT)
545 pts
Single-Thread
430 pts
The 9800X3D scores close to a stock 9700X in Cinebench 2026. The 3D V-Cache advantage that showed up clearly in R23 and R24 does not carry over. The 2026 rendering algorithm does not benefit from the extra cache in the same way. With PBO enabled and scalar set to x1, it still scores around where a non-3D 8-core would land.
| Benchmark | Multi-Core | Single-Core |
|---|---|---|
| Cinebench R23 | ~23,300 to 24,100 pts | ~2,050 to 2,100 pts |
| Cinebench 2026 | ~5,383 pts | ~430 pts |
These numbers are not comparable because they use different engines, scales, and scenes.
9800X3D vs other 8-core CPUs
| CPU | CB 2026 nT | Gaming Priority |
|---|---|---|
| AMD Ryzen 7 9850X3D | ~5,538 pts | Best in class |
| AMD Ryzen 7 9800X3D | ~5,383 pts | Gaming-first |
| AMD Ryzen 7 9700X | ~5,262 pts | Rendering-balanced |
| AMD Ryzen 7 7800X3D | ~4,386 pts | Previous-gen gaming |
For gaming, the 9800X3D still leads. Cinebench multi-core scores do not reflect gaming performance because games are not rendering engines.
Cinebench GPU Scores in 2026
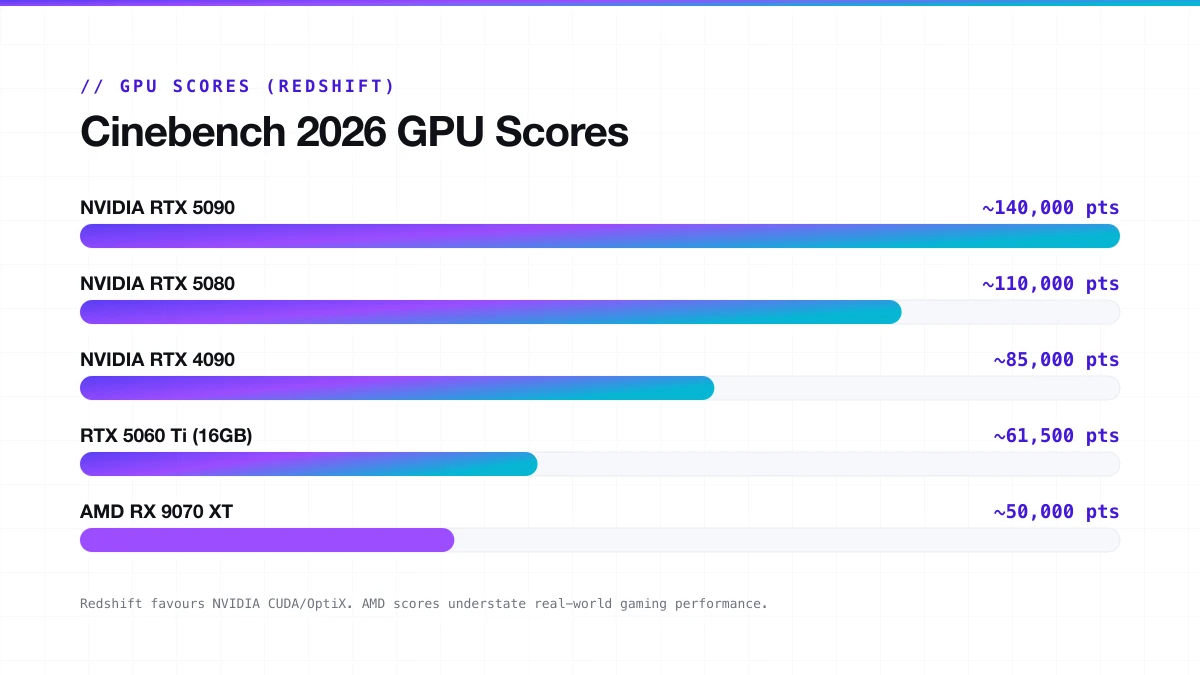
Cinebench 2026 introduced an accurate GPU benchmark using Redshift. The catch is that NVIDIA GPUs perform far better because Redshift has been extensively optimised for CUDA and OptiX, not so much for RDNA 4, which arrived in 2026.
| GPU | CB 2026 GPU Score (approx.) |
|---|---|
| NVIDIA RTX 5090 | ~130,000 to 150,000 pts |
| NVIDIA RTX 5080 | ~108,000 to 112,000 pts |
| NVIDIA RTX 4090 | ~80,000 to 90,000 pts |
| NVIDIA RTX 5060 Ti (16GB) | ~61,000 to 62,000 pts |
| AMD RX 9070 XT | ~49,000 to 52,000 pts |
| AMD RX 7900 XT (via HIP) | ~25,000 to 30,000 pts |
| Apple M2 Pro (integrated) | ~13,000 pts |
AMD GPU scores do not reflect full hardware capability. The gap between an RTX 5080 and an RX 9070 XT in gaming benchmarks is nowhere near as large as it looks here.
AMD GPU score running low?
Run-to-run variance is higher in the GPU test than in the CPU test. AMD cards in particular can slip into a low-power state during the GPU render pass, producing results well below their real ceiling. If your AMD GPU score looks unusually low, check power draw in GPU-Z or HWiNFO64 while the test runs.
Cinebench 2026 Score Ranges
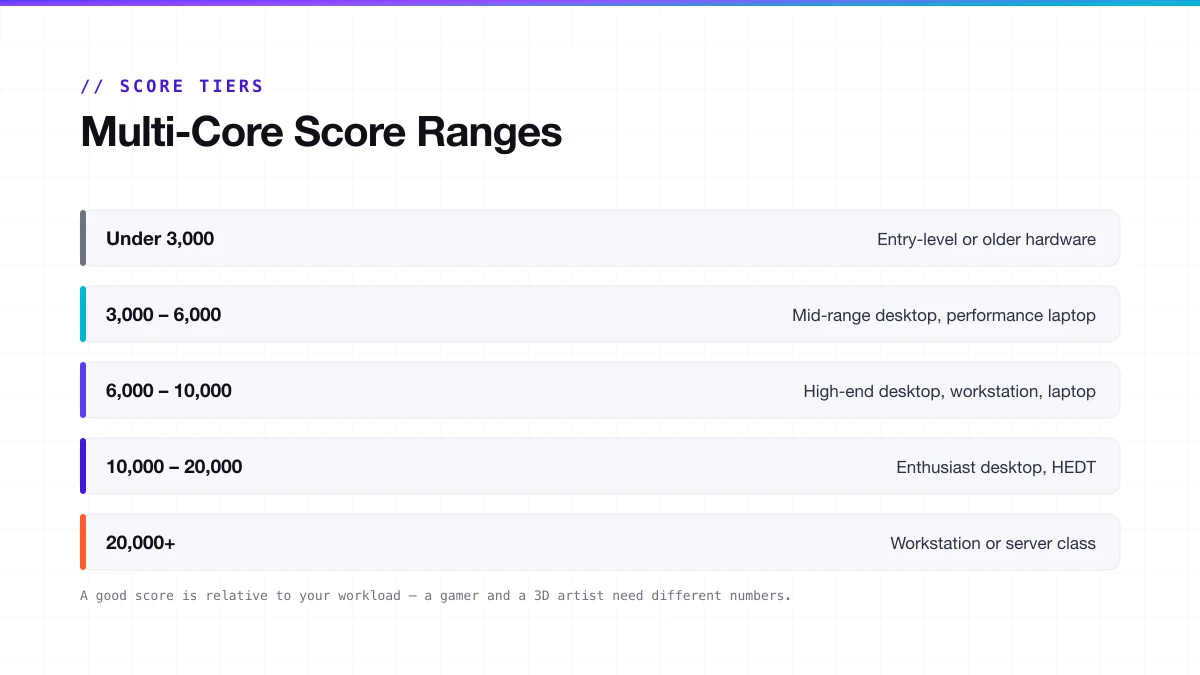
Good scores depend on what you are doing, because a 3D artist and a gamer do not need the same number. A good score for one person might not be so good for the other.
Multi-core score tiers
| Score Range | What It Means |
|---|---|
| Under 3,000 | Entry-level or older hardware |
| 3,000 to 6,000 | Mid-range desktop, performance laptop |
| 6,000 to 10,000 | High-end desktop, workstation, laptop |
| 10,000 to 20,000 | Enthusiast desktop, HEDT |
| 20,000+ | Workstation or server class |
For mainstream desktop buyers in 2026, the ceiling on a single-socket consumer chip sits around 9,700 to 10,100 points. Anything above that requires HEDT or server-class hardware.
Single-thread score tiers
| Score Range | Performance Level |
|---|---|
| Below 400 | Older or entry-level hardware |
| 400 to 550 | Mid-range mainstream |
| 550 to 700 | High-end desktop, modern laptop |
| Above 700 | Enthusiast, flagship chips |
By use case
| Use Case | Target nT | Target ST |
|---|---|---|
| General productivity | 4,000 to 6,000 | 400 to 550 |
| Gaming (CPU-side) | 5,000 to 8,000 | 550 to 700 |
| 3D rendering / video | 8,000 to 15,000+ | 600+ |
| Professional workstation | 15,000 to 30,000+ | 700+ |
How the Scale Changed: 2024 vs 2026
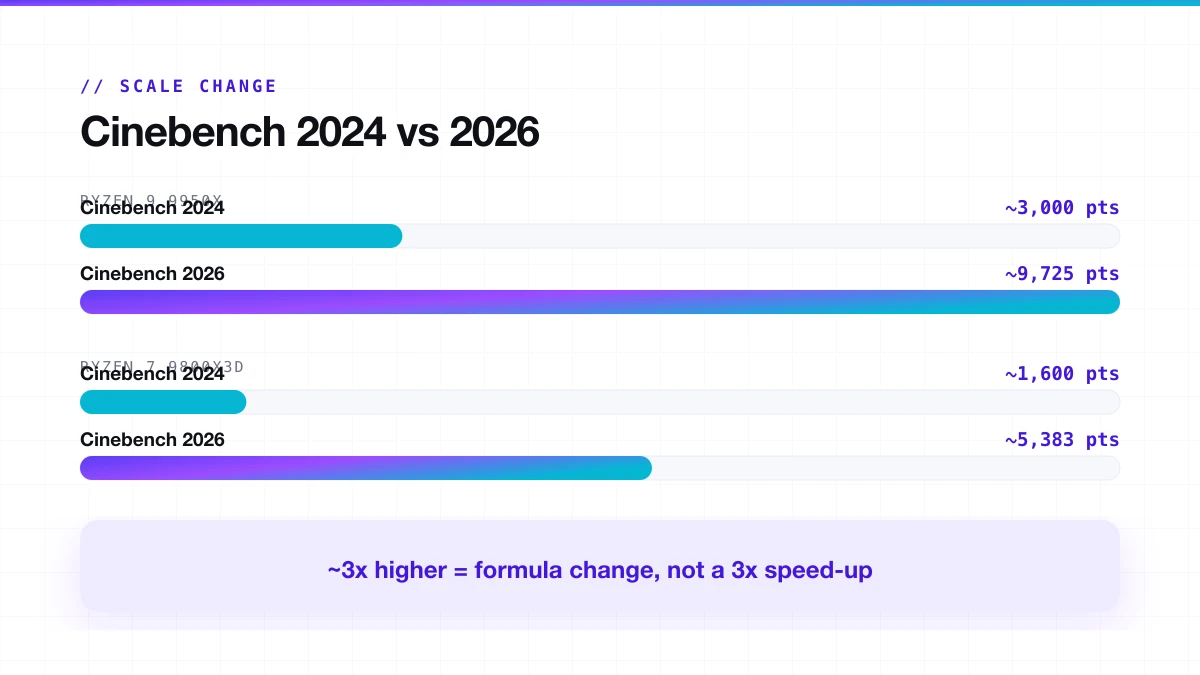
Cinebench 2026 finishes the same CPU multi-threaded render about 13% faster than 2024 thanks to the new Clang V19 compiler. But the score itself is roughly 3x higher because the scoring formula was recalibrated to apply a larger multiplier per work unit. This was intentional: Maxon wanted the two versions to be clearly distinguishable.
| CPU | CB 2024 nT | CB 2026 nT |
|---|---|---|
| AMD Ryzen 9 9950X | ~3,000 pts | ~9,725 pts |
| Intel Core Ultra 9 285K | ~2,600 pts | ~9,763 pts |
| AMD Ryzen 7 9800X3D | ~1,600 pts | ~5,383 pts |
| Feature | Cinebench 2024 | Cinebench 2026 |
|---|---|---|
| Rendering engine | Redshift (older build) | Redshift from Cinema 4D 2026 |
| Multi-thread workload | Baseline | 6x heavier |
| SMT single-core test | No | Yes |
| Score compatibility | Incompatible with R23 | Incompatible with 2024 |
| GPU support | RTX 4000, RX 7000 | Adds RTX 5000, RDNA 4, M4, M5 |
| Minimum RAM | 8 GB | 16 GB |
| Score scale | Lower | Roughly 3x higher |
How to Improve Your Cinebench Score
CPU score
- Close all background applications.
- Update BIOS and chipset drivers before running.
- Enable XMP or EXPO in BIOS; memory speed affects multi-core performance more than most people expect.
- Make sure your cooler is making full contact. A 2 to 3°C drop in peak temp can recover several hundred points on high-TDP chips.
- Set Windows power plan to High Performance or use AMD's Ryzen Balanced plan.
- For AMD: enable PBO in BIOS for automatic boost headroom.
- For Intel: confirm MCE settings in BIOS match your motherboard's intended power delivery.
GPU score
- Update GPU drivers. Redshift performance improves between driver releases for both NVIDIA and AMD.
- Verify the GPU is not thermally throttling during the test.
- Do not run CPU and GPU tests at the same time.
- For AMD: monitor power draw in HWiNFO64 to confirm the card is not entering a low-power state mid-run.
Cinebench 2026 as a Stress Test
Cinebench 2026 makes a solid stress test. The minimum runtime forces the CPU to hold load long enough that thermal and power limits actually matter. A chip that boosts to 5.3 GHz for 30 seconds and throttles to 4.6 GHz will not post the same number as one that holds 5.3 GHz the whole way through. Advanced Benchmark mode extends the run time further. For the full method, see our Cinebench stress test guide.
Why your score is lower than expected
| Cause | Fix |
|---|---|
| Thermal throttling | Better cooler, repaste, improve case airflow |
| BIOS power limits set too low | Check PPT / PL1 limits in BIOS or AMD PBO settings |
| Background apps running | Close everything before testing |
| Outdated BIOS or chipset drivers | Update both before benchmarking |
| RAM not running at rated speed | Enable XMP or EXPO in BIOS |
One data point, not a verdict
Cinebench is a rendering benchmark. It does not measure gaming performance, compile times, AI workloads, or general productivity. Treat it as one data point in a broader system evaluation.
Frequently Asked Questions
Can I compare Cinebench 2026 scores with R23?
No. The rendering engine, compiler, scene complexity, and scoring formula are all different. The scales are incompatible. Only compare scores from the same version.
Does Cinebench 2026 work on older CPUs?
Yes, as long as you have at least 16 GB of RAM. Older CPUs will score lower, but the benchmark will run. Systems with less than 16 GB will see a warning before the test starts.
Is a higher Cinebench score always better?
Within the same version, yes. Across versions, a higher number means nothing. A CB2026 score of 6,000 and a CB2024 score of 6,000 represent completely different performance levels.
Why does my 9800X3D score lower in 2026 than in R23?
Cinebench 2026's updated rendering algorithm does not hit the cache the same way. With PBO and scalar set to x1, the 9800X3D scores near a stock 9700X. It is not a hardware problem.
Does Cinebench 2026 measure gaming performance?
No. Cinebench renders 3D scenes using Redshift. It has nothing to do with real-time rendering, frame timing, or the GPU driver paths used in games.
Why is my AMD GPU score low in Cinebench 2026?
AMD RDNA 4 support in Redshift was added in 2026, but driver-level optimisation is still catching up. A low AMD GPU score here does not reflect how that card performs in gaming or in other rendering software.
What is the MP ratio, and why does it matter?
The MP ratio is your multi-core score divided by your single-thread score. It tells you how well your CPU scales across all its cores.
New to Cinebench?
Start with the full guide: how to download, run, and read every score, version by version.
Read the complete Cinebench guide →// Continue reading
Cinebench MP Ratio: What's Good & How to Fix a Low One
Your Cinebench MP Ratio shows how well your CPU scales across all cores. See what a good ratio looks like by core count and how to fix a low one.
Read guideCinebench Stress Test: How to Run It the Right Way
Use Cinebench as a real CPU stress test: how to set it up, how long to run it, what to watch, and when you need Prime95 or OCCT instead.
Read guide