Cinebench MP Ratio: What's Good & How to Fix a Low One
Your Cinebench MP Ratio shows how well your CPU scales across all cores. See what a good ratio looks like by core count and how to fix a low one.
The MP Ratio is one of the most overlooked numbers in your Cinebench results. It tells you exactly how efficiently your CPU scales from a single core to all cores under full load, and what is holding it back if it does not.
Every Cinebench result shows three numbers: single-core score, multi-core score, and the MP Ratio. Most people check the first two and ignore the third. That is a mistake, because the MP Ratio is the one that actually shows whether your CPU is performing at its potential or quietly throttling under load.
This guide covers what a good MP Ratio looks like for your specific CPU, how to read yours correctly, and what to do when the number is lower than it should be. Check our complete Cinebench guide for the full download walkthrough.
What Is the Cinebench MP Ratio?
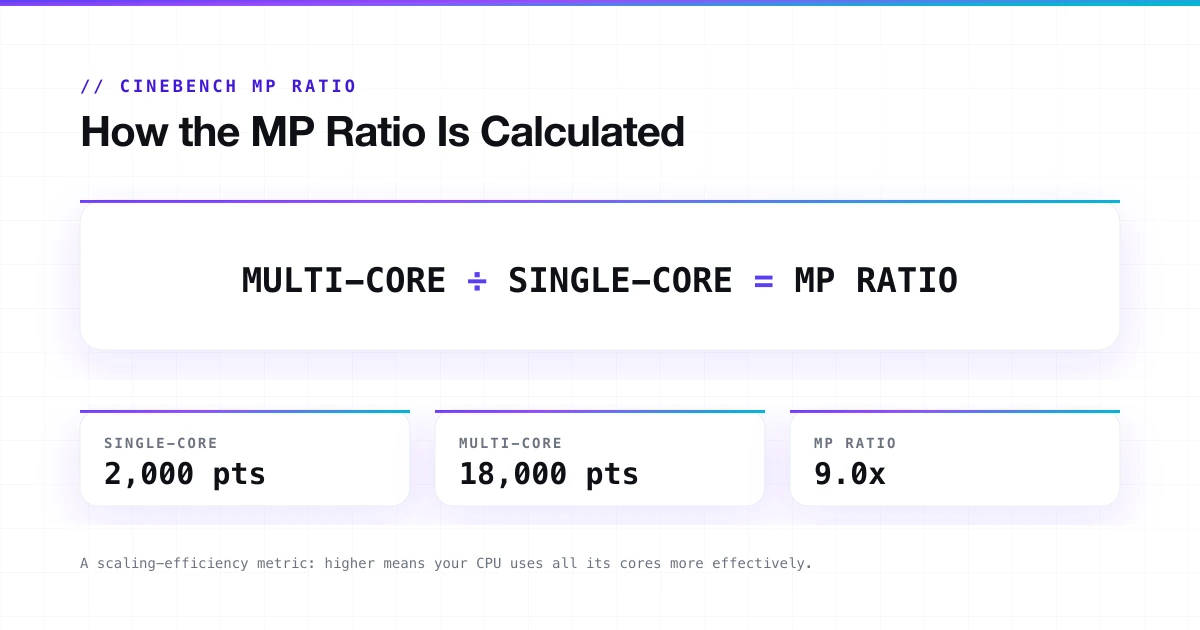
The MP Ratio is your multi-core score divided by your single-core score. If your single-core score is 2,000 and your multi-core score is 18,000, your MP Ratio is 9.
MP stands for Multi-Processor. The number tells you how much faster your CPU runs when all cores work simultaneously compared to one core working alone. It is a scaling-efficiency metric. A higher ratio means your CPU is putting its full core count to effective use.
Single-Core
2,000 pts
Multi-Core
18,000 pts
MP Ratio
9.0x
Cinebench calculates and displays this automatically in every result. You do not need to calculate it manually.
How to Measure Your MP Ratio
Cinebench shows your MP Ratio automatically after completing both the single-core and multi-core tests. You do not need to do anything special to see it, but you do need to run both tests in the same session.
Steps to get an accurate MP Ratio reading:
- Close all background applications before starting: browsers, Discord, cloud sync, and antivirus scans.
- Set your Windows power plan to High Performance or Ultimate Performance.
- Plug in your laptop if you are on battery.
- Run the CPU Multi-Core test first.
- Run the CPU Single Core test immediately after, in the same session.
- Read the MP Ratio from the results panel.
- Run the full sequence two or three times and compare results; consistency matters more than a single high reading.
Things that distort your MP Ratio
Background tasks consuming CPU threads during the multi-core test, a Balanced or Power Saver Windows plan capping boost clocks, running on battery on a laptop, or comparing scores across different Cinebench versions (R23 and 2026 are completely different scales).
For score comparison and to see where your CPU sits against similar hardware, check our Cinebench 2026 scores database.
What Is a Good MP Ratio in Cinebench?
The answer depends on your CPU. There is no universal "good" number because it is relative to core count and architecture.
Standard (uniform-core) CPUs
Ideally, your MP Ratio sits close to your physical core count. A CPU with 16 cores should show a ratio near 16. In practice, it almost always falls short because single-core boost clocks run significantly higher than all-core sustained clocks under full thermal load.
| Core Count | Expected MP Ratio Range |
|---|---|
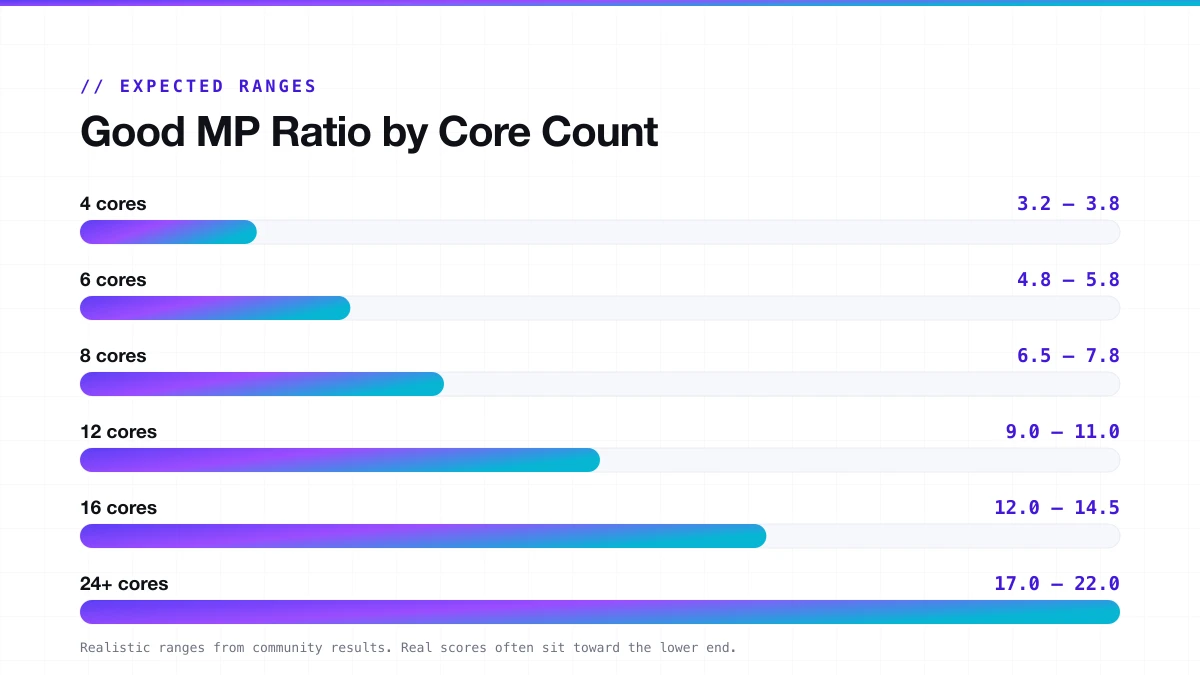
| 4 cores | 3.2 to 3.8 |
| 6 cores | 4.8 to 5.8 |
| 8 cores | 6.5 to 7.8 |
| 12 cores | 9.0 to 11.0 |
| 16 cores | 12.0 to 14.5 |
| 24+ cores | 17.0 to 22.0 |
These are realistic ranges based on community results across R23, Cinebench 2024, and Cinebench 2026. Real-world scores often sit toward the lower end of each range, especially on systems with conservative cooling or power limits.
Hybrid-core CPUs (Intel Core Ultra, Intel 12th to 14th gen)
Hybrid CPUs mix high-performance P-cores with efficient E-cores. E-cores run at much lower clock speeds. Your total thread count looks high, but not all threads contribute equally, so the MP Ratio naturally comes out lower relative to thread count. An Intel Core i9 with 24 cores and 32 threads, showing an MP Ratio of 10 to 12, is not broken. That is expected.
Laptops vs desktops
Laptops throttle faster and harder under all-core load. The same chip name in a laptop will show a lower MP Ratio than in a desktop. That is normal behavior for a thin chassis hitting its sustained TDP limit. Compare your laptop result only against other results for your specific laptop model, not against desktops.
Why Is Your MP Ratio Lower Than Expected?
This is the question most people actually have. You know your core count. Your ratio looks lower than it should be. Here is what causes that.
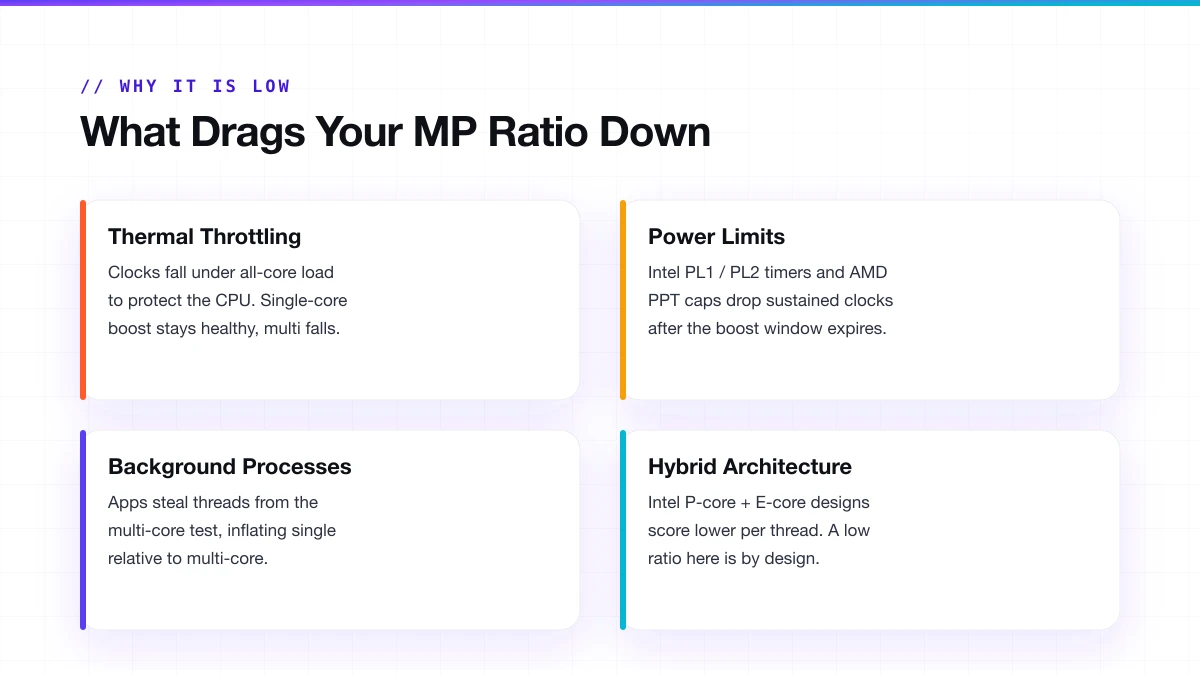
Thermal throttling
The most common cause. Under full all-core load, CPUs generate significantly more heat than under single-core load. When temperatures get too high, the CPU drops its clock speeds to protect itself. Single-core boost stays healthy. Multi-core clocks fall. The ratio shrinks.
How to confirm it: run a temperature monitoring tool alongside Cinebench during the multi-core test, watch your CPU clock speeds during the run (not just after), and if clocks drop noticeably after 1 to 3 minutes, thermal throttling is active. Temps above 95°C sustained during the multi-core test confirm it. For a full walkthrough on diagnosing throttling during a benchmark run, see our Cinebench stress test guide.
Power limit throttling
Intel CPUs have a short-duration boost power limit (PL2) and a long-duration sustained limit (PL1). After the PL2 timer expires, the CPU drops back to PL1, and multi-core clocks fall. Your score peaks in the first 30 to 60 seconds, then settles lower. This is the default BIOS behavior on many boards and is not a defect. AMD has the equivalent in PPT (Package Power Tracking). A low PPT setting caps all-core performance while single-core boost stays unrestricted.
Background processes
Even small background tasks steal threads from Cinebench during the multi-core test. A single-core test is less affected because it only needs one thread. This creates a gap that inflates the single-core score relative to multi-core, pulling the ratio down. Close everything before running, and retest before assuming it is a hardware problem.
Hybrid architecture
If you have an Intel Core Ultra or 12th to 14th gen hybrid chip, a lower-than-thread-count ratio is the design, not a problem. The E-cores add throughput but at lower per-thread efficiency than P-cores.
How to Improve Your MP Ratio
Improving the ratio means closing the gap between your single-core and multi-core performance. That usually means either improving sustained all-core clocks or fixing what is dragging them down.
Fix thermal throttling first
- Repaste the CPU. Thermal paste degrades over 18 to 24 months. A fresh application of quality paste can drop peak temps by 5 to 12°C on older builds, directly recovering throttled all-core performance.
- Check cooler mounting pressure. A slightly loose cooler adds a real temperature penalty, more common than people expect after a few years.
- Add case exhaust airflow. One rear exhaust fan makes a measurable difference to sustained temps on intake-only setups.
- Update fan curves in BIOS. Set fans to ramp harder earlier under load rather than waiting until the CPU already hits 95°C.
Adjust BIOS power limits
- On Intel: raise PL1 to match PL2, or set both to a value your cooler can actually handle. Removing the time-limit throttle lets the CPU sustain higher clocks throughout the run.
- On AMD: raise the PPT limit in BIOS if it is set too conservatively.
- Do not raise these limits beyond what your cooling can sustain, or you will just create thermal throttling instead of power throttling.
Software and OS settings
- Set Windows power plan to High Performance before running, not after.
- On AMD Ryzen systems, Windows 11 handles thread scheduling better than Windows 10 for multi-core workloads.
- Disable any BIOS eco or quiet mode profiles that throttle power delivery.
For overclockers
- An all-core overclock directly targets the multi-core side of the ratio.
- PBO (Precision Boost Overdrive) on AMD chips raises all-core boost without touching single-core, improving the ratio.
- If scores vary widely between runs on an overclocked system, the OC is marginally unstable and the all-core voltage may need adjustment.
MP Ratio in Cinebench 2026
Cinebench 2026 added something that changes how MP Ratio works at the single-core level. It now includes a dedicated SMT (Simultaneous Multithreading) test alongside the traditional tests. This new test runs a single physical core twice: once with SMT (Hyper-Threading) enabled, once without. The ratio between those two scores is its own MP Ratio for that individual core's threading efficiency.
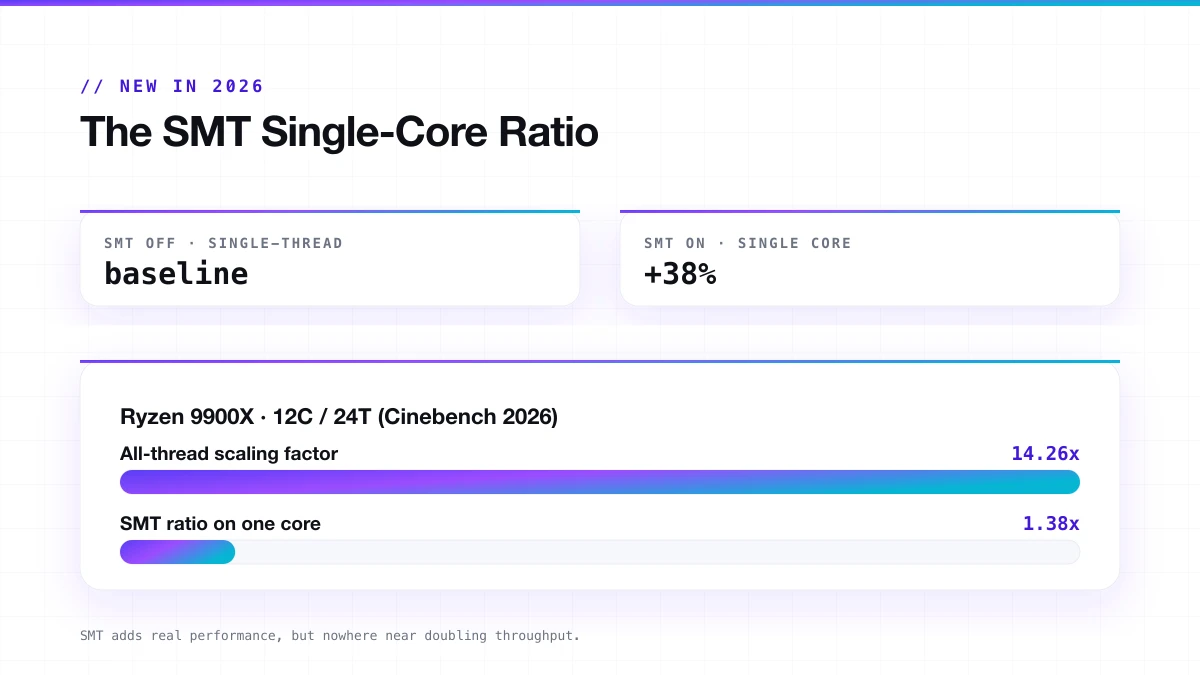
On a Ryzen 9900X tested with Cinebench 2026, the full all-thread scaling factor came out at around 14.26x on a 12-core/24-thread CPU. The SMT-specific ratio on a single active core was 1.38x. SMT adds real performance, but it is nowhere close to doubling throughput the way raw thread-count math might suggest.
What the SMT MP Ratio tells you:
- How much actual benefit your CPU gets from virtual threads per physical core.
- Whether disabling SMT/Hyper-Threading in BIOS would noticeably hurt performance for rendering tasks.
- How your architecture compares to others at the per-core threading level, useful for Intel P-core vs E-core comparisons.
This is a new capability that no previous version of Cinebench had. Scores from 2026 are not comparable to R23 or 2024: different engine, different scale.
Frequently Asked Questions
What does MP Ratio mean in Cinebench?
It is your multi-core score divided by your single-core score. It shows how much faster your CPU runs with all cores active versus one core working alone.
What is a good MP Ratio in Cinebench?
An 8-core CPU should land around 6.5 to 7.8. A 16-core CPU around 12 to 14.5. Hybrid-core CPUs and laptops will naturally show lower numbers relative to their thread count.
Why is my MP Ratio so low?
Most commonly: thermal throttling under all-core load, power limit throttling (PL1/PL2 on Intel, PPT on AMD), or background processes stealing CPU threads during the test.
Can I improve my MP Ratio without buying new hardware?
Yes. Fixing case airflow, adjusting BIOS power limits, repasting the CPU, and closing background tasks before running all improve multi-core sustained performance without spending anything.
Does Cinebench 2026 change the MP Ratio?
The traditional MP Ratio (multi ÷ single) works the same. Cinebench 2026 also added a new SMT-specific ratio measuring per-core threading efficiency. These are two different numbers.
Is a higher MP Ratio always better?
Not necessarily. A very high ratio can sometimes mean your single-core score is unusually low, which inflates the ratio without meaning your multi-core performance is exceptional.
New to Cinebench?
Start with the full guide: how to download, run, and read every score, version by version.
Read the complete Cinebench guide →// Continue reading
Cinebench 2026 Scores: Full CPU & GPU Database
Cinebench 2026 CPU and GPU scores, score ranges by tier, and what a good score looks like, plus R23 reference data and how the scale changed.
Read guideCinebench Stress Test: How to Run It the Right Way
Use Cinebench as a real CPU stress test: how to set it up, how long to run it, what to watch, and when you need Prime95 or OCCT instead.
Read guide